
The Awesome Science of Traffic
By Ana Cheng
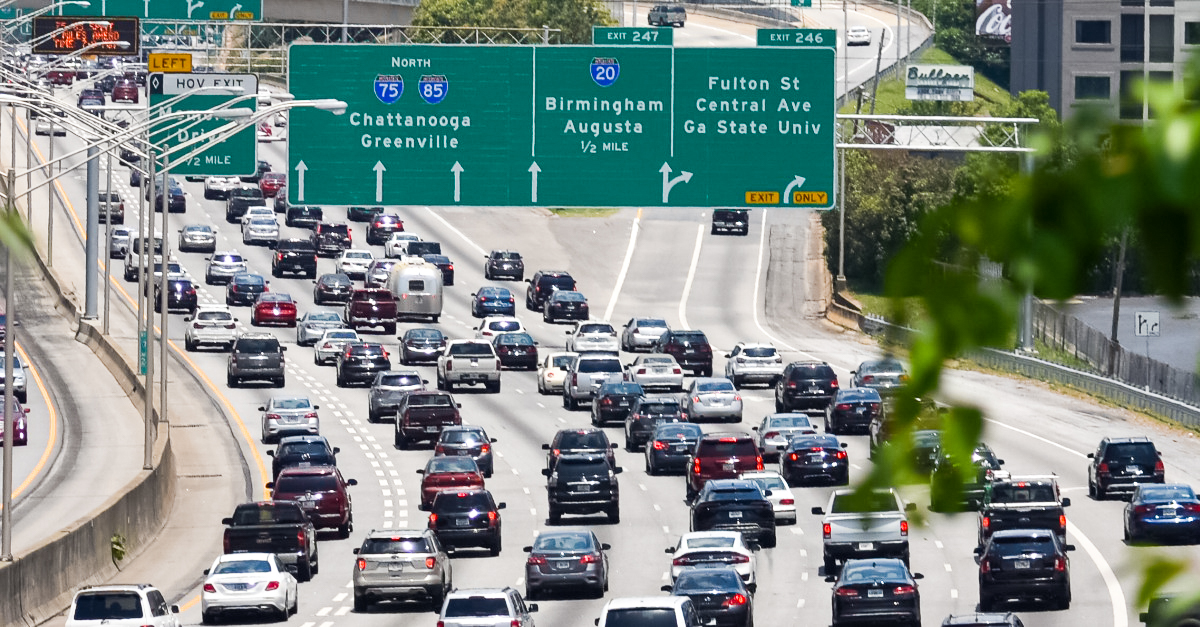
Atlanta is the 11th most congested city in the country, and most ATLiens are familiar with the frustrating ballet of rush hour traffic. On average, drivers lose 97 hours and $1,348 each year just stuck in traffic. Atlanta is also the fourth fastest-growing city in the country, meaning our roads will have to support increasingly more commuters year over year. However, like with most modern-day problems, there are teams of scientists and engineers heroically searching for ways to improve our lives. I spoke with Dr. Jorge Laval, a civil engineering professor at Georgia Tech who specializes in transportation, to find out more.
What is Traffic Theory?
The field of traffic theory can trace its roots back to the mid-twentieth century, shortly after cars gained popularity. Engineers began measuring traffic flow with cameras and appropriated fluid mechanical concepts to describe the patterns they observed, likening traffic to the flow of water in rivers. Since then, new models and technology have enabled research through advanced simulations of driver behavior. Dr. Laval, who has been studying transportation for twenty years, uses this technology to study traffic patterns. He’s among a handful of transportation researchers at Georgia Tech and part of the Georgia Transportation Institute, a consortium of researchers at various universities working in policy and planning, environmental issues, transportation technology and infrastructure, and traffic operations.
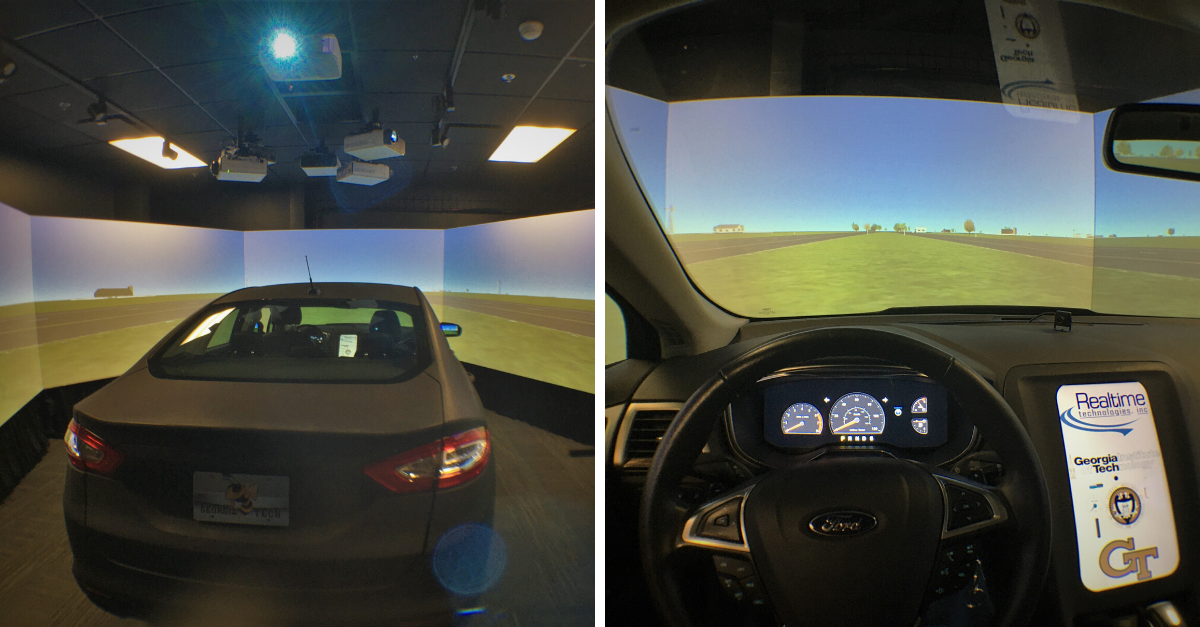
The Autonomous and Connected Transportation Driving Simulator Laboratory (ACT-DSL), a driving simulator in the lab of Dr. Srinivas Peeta (Georgia Tech) which helps researchers better understand human driving behavior.
Although these researchers use sophisticated simulations and math to understand traffic patterns, one does not need a PhD in civil engineering to understand the real-world effects of congestion. “You’re a driver, so you experience it every day,” says Dr. Laval. Take, for instance, the concept of capacity drop. Capacity refers to the maximum number of vehicles that may pass a given point on a road during a given period of time. Because of varying road conditions like accidents or lane changes, this number might drop, causing a disproportionate effect on traffic. “When [capacity] drops, it goes down by typically 10-20%. It doesn’t sound like much, but in queueing systems like these, that’s a huge difference. It could mean twice the delay,” explains Dr. Laval.
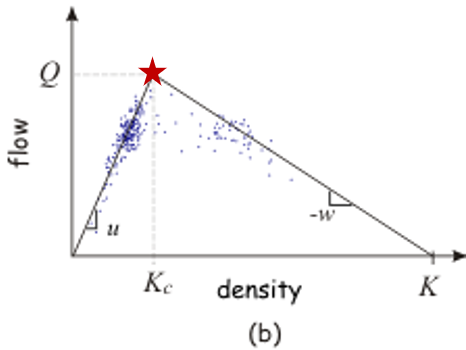
To understand factors that contribute to changes in capacity on a macroscopic scale, he and other theorists utilize fundamental diagrams, created using data collected by loop detectors (those pairs of black cables laid across the road). Every city or “network” of roads has a unique set of properties that give it a characteristic fundamental diagram, meaning that the diagrams for Atlanta and Los Angeles will be different. Once researchers have obtained a diagram for a specific network, all they need to know to understand current road conditions is the number of vehicles on the road, which they can count with loop detectors. From this, they can glean the average speed and travel time for any given path. For example, researchers can look at the diagram below and find the optimum density of cars for maximum flow or the least traffic (labeled with a red star).
What Causes Traffic?
In order to apply what they know, researchers must first understand what causes traffic in the first place. Freeway on-ramps, accidents, and rubbernecking are obvious culprits. The unifying factor in all traffic jams is human error. Consider the on-ramp scenario: when vehicles enter the freeway, they’re typically going slower than the rest of traffic, creating small disturbances in flow. It’s made worse when other cars start to change lanes, causing disruptions across multiple lanes. In fact, lane-changing activity is the main contributor to capacity drop. In other situations, traffic jams seemingly appear out of nowhere. In these cases, slight variations from driver to driver lead to minute braking and acceleration, which become magnified as following cars react. Dr. Laval calls these stop-and-go waves.
In downtown areas, traffic is mainly influenced by the length of city blocks and the timing of green lights (called green time). Short blocks mean a lot of stopping and starting, which is a recipe for traffic disaster. If the lights aren’t synchronized efficiently, spillback can happen. Spillback is the phenomenon that occurs when cars move forward because their light turned green, but end up blocking intersections because the next light is still red. The ideal grid has long blocks and short green lights, minimizing the spillback effect. However, if we zoom out on dense urban areas, not even traffic light coordination has much of an effect on the average speed of the network. The main factors remain the block length and average green time.
As for why Atlanta traffic is especially bad; it’s surprisingly not due to our non-grid layout. Dr. Laval blames sprawl and underuse of public transport for increasing the number of vehicles on the road. Moreover, our infrastructure was built using outdated traffic models—and for a much smaller population than that of present-day Atlanta.
Fortunately, Dr. Laval is working on ways to bring our roadways into the twenty-first century. He’s developed a variable speed limit algorithm which adjusts the maximum speed on the freeway to optimize the capacity. “It hasn’t worked really well because people don’t comply,” he laments. It’s because the algorithm can sometimes seem counterintuitive: drivers who read a speed limit of 45 mph tend to drive faster if they don’t see many cars on the freeway, even though the displayed limit will improve the capacity. So now Dr. Laval is hoping to coordinate variable speed limits with real-time ramp metering algorithms—algorithms that respond to current traffic conditions by adjusting the rate of green lights—in a collaboration with the Georgia Department of Transportation (GDOT).
Reducing Traffic Congestion
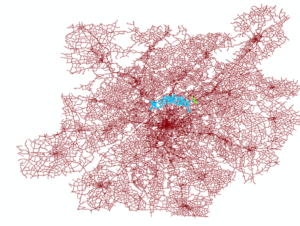
Diagram of Atlanta’s roads, courtesy of Dr. Laval.
The unfortunate truth is that to minimize overall traffic, some people would have to take longer routes. It might seem straightforward for every driver to take the most direct route to their destination, but this has a hidden social cost—increased traffic due to congestion on popular roads. Introducing congestion pricing might help accomplish that by making it less enticing to take a busy road if it comes with a pricier toll, even though it may be the shortest route. With this system, “People act as if they’re minimizing their own cost, but they internalize their social cost. That’s one way in theory that you can have people choose their own routes but have tolls such that the equilibrium is going to give you the system optimum,” explains Dr. Laval.
In other words, by making the more socially costly (read: busier) roads more financially costly with tolls, enough drivers will take the cheaper routes that it will minimize the overall traffic. However, it may mean that only wealthier drivers have an improved driving experience. Alternatively, apps like Waze and Google Maps also have the power to offer drivers alternate routes that would improve overall traffic without the economic barrier posed by congestion pricing. Being able to regulate the behavior of every car through an app? “That’s the holy grail of city planning,” says Dr. Laval.
Another simple fix is encouraging more people to utilize public transit options. Studies have found that if 1% of drivers opted for public transit, average commute times could be reduced by 18%. Further, because less congestion would lead to more reliable bus schedules, it would start a virtuous cycle that would make public transit even more appealing and reduce traffic in addition to its environmental and health impacts.
“We know nothing about (autonomous vehicles) and that’s a problem because they’re coming—they’re already here.”
Overall, in order to truly eradicate congestion, we must remove human error from the driving equation. Could autonomous vehicles (AVs) be the grand solution? Dr. Laval explains there’s a shift happening in the field of traffic research as AVs have begun to hit the road. “We know nothing about AVs and that’s a problem because they’re coming—they’re already here,” he says, “We don’t know what they are going to do to capacity. My bet is that it’s going to be bad in the beginning. Due to safety concerns, they will overreact and be very conservative by driving really slowly.” In fact, the current models show that when mixed in with human drivers AVs are worse for traffic, likely due to programming that overcompensates for safety concerns. We may not see the benefits of AVs until they make up the majority of the road. So until their inevitable takeover, take the bus when possible, obey variable speed limits, and don’t change lanes near bottlenecks.
Thank you to Dr. Jorge Laval for navigating through the science of traffic patterns in Atlanta! Follow Science ATL on Facebook, Twitter, and Instagram for more Awesome Science of Everyday Life features and other science updates.


